The 10-Second Latency Spike That Never Happened
TL;DR: Our p99 latency dashboard showed a spike to 10 seconds. The logs were clean, there were no slow traces, and nothing was actually slow. The spike was an artifact of histogram_quantile() linearly interpolating across a wide bucket near the top of our Prometheus histogram. If your bucket boundaries leave wide gaps anywhere a percentile can land, you have this bug too.
The spike
One of our gRPC endpoints sits comfortably under a second. Then a dashboard lit up: p99 climbing to 7.8s, pinning at 10s for two scrapes, dropping to 6.5s, then back to normal. A clean trapezoid.
I went looking for the slow requests. The logs were clean. No slow traces. No deploy, no GC pause, no upstream timeout lining up with the window. Nothing was actually slow.
The shape itself was the first clue. Real production latency is noisy — it doesn’t climb a ramp, sit flat at exactly 10.000s for two scrapes, and walk back down. A clean plateau at a round number isn’t latency. It’s a boundary.
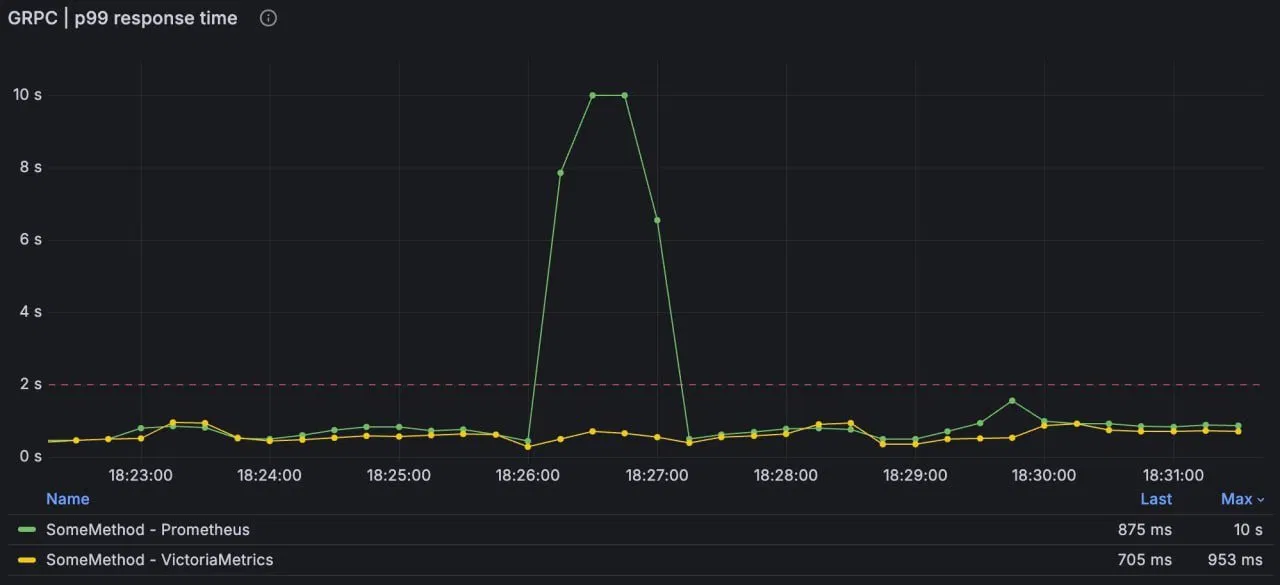
The green line is Prometheus with our hand-tuned buckets. The yellow line is the same method, same requests, same window, measured with a second histogram from a different library. Yellow never leaves the floor — max 953ms. The requests were identical. Only the bucketing differed. One of these lines is lying, and it’s the one that spiked.
Why nothing was actually slow
Prometheus histograms don’t store your observed values. They store counts per bucket: “N requests were faster than 0.5s, M requests were faster than 1s,” and so on, with cumulative counts up to each le (“less than or equal”) boundary.
histogram_quantile() reconstructs a percentile from those counts. It finds the bucket the percentile falls into, then linearly interpolates inside that bucket, assuming the observations are spread evenly between the bucket’s lower and upper bound. That assumption is the whole story.
If a bucket spans 0.5s to 1s and the percentile lands a third of the way through its counts, you get ~0.67s. Fine — the bucket is narrow, so even a wrong distribution assumption can’t be off by much. The interpolation error is bounded by the bucket width.
Now make the bucket wide.
The wide bucket in the tail
Here were our buckets:
prometheus.NewHistogramVec(
    prometheus.HistogramOpts{
        Name:    "external_call_duration_seconds",
        Help:    "Distribution of external call duration in seconds",
        Buckets: []float64{
            .005, .01, .025, .05, .1, .25, .5, 1, 5, 10,
        },
    },
    []string{"method", "status"},
)
Look at the top. Almost all our traffic finishes under a second, so we packed resolution below 1s — and then got lazy. Above 1s there are exactly two boundaries: 5 and 10. That leaves two wide buckets, 1→5 and 5→10, each four to five seconds across, sitting right above where our real latency lives.
Under normal load, p99 sits down in the fine-grained buckets and the math is accurate — that’s the yellow line, and Prometheus would agree with it. But during the spike, a handful of slower requests pushed the p99 count up past the 1s boundary. The percentile rank climbs through the near-empty 1→5 bucket and lands in 5→10.
Both of those buckets are nearly empty — almost no real traffic lives above a second — so interpolation has almost nothing to work with. With the rank sitting near the top of the near-empty 5→10 bucket, linear interpolation reports a value close to its upper bound: ~10s. A sub-second shift in real latency got reported as a 10-second spike, because the only landmark the formula had was the boundary we’d put there by hand.
The trapezoid makes sense now: as the percentile rank crossed into the wide buckets and climbed, interpolation reported 7.8s, then ~10s, then walked back down as the slow requests aged out of the window. None of those numbers corresponded to a request that actually took that long — the real p99 never left the floor.
The obvious fix is wrong
The reflex is to add more buckets in the tail. More boundaries, smaller gaps, smoother line.
That’s not a fix. It’s relocating the problem. Hand-picked buckets encode a guess about where your latencies will be, and that guess goes stale — traffic shifts, a dependency slows down, a new code path lands. Wherever you stop adding boundaries by hand, you’ve created the next wide bucket for a future percentile to fall into and lie about. You haven’t removed the failure mode; you’ve moved it somewhere you’ll forget to look. The prometheus/client_golang histogram takes a static bucket list at construction, so “tune the boundaries” is the only lever it gives you, and it’s a lever you have to keep re-pulling forever.
The actual problem isn’t too few buckets. It’s wide buckets anywhere your percentiles might land, combined with linear interpolation that’s only as accurate as the bucket is narrow.
Log-spaced buckets
What you want is buckets that are narrow everywhere across the range, not just in the region you guessed at. That means spacing them logarithmically rather than linearly, so each bucket covers a fixed relative slice of the range.
I switched the metric to VictoriaMetrics/metrics, whose histogram auto-generates log-spaced buckets covering a huge range, each bucket bounded to roughly 10% relative error:
name := fmt.Sprintf(
    "external_call_vm_duration_seconds{method=%q,status=%q}",
    method, status,
)
metrics.GetOrCreateHistogram(name).UpdateDuration(start)
No bucket list. No boundaries to maintain. Narrow buckets across the whole range mean small interpolation error across the whole range — including the tail, where the old histogram fell apart. That’s the yellow line: same traffic, same percentile math, but the percentile now lands in a bucket narrow enough that the answer is close to real. Max 953ms, no trapezoid.
When classic Prometheus histograms are fine
This bit us specifically because our hand-picked buckets had a coarse, wide tail and a percentile wandered into it. If your buckets already cover your actual latency range at fine resolution — including a realistic tail — classic Prometheus histograms are completely fine, and the interpolation stays accurate.
So the takeaway isn’t “Prometheus histograms are broken” or “switch libraries.” It’s narrower than that: wide buckets plus linear interpolation produce confident, completely fake numbers, and a flat plateau at a round value is the signature. If you maintain bucket boundaries by hand, go look at your widest le gap and ask what histogram_quantile() returns when a percentile lands inside it.